Knot Refinement
Added in version 5.1.
Knot refinement is simply the operation of inserting multiple knots at the same time. NURBS-Python (geomdl) supports
knot refinement operation for the curves, surfaces and volumes via operations.refine_knotvector() function.
One of the interesting features of the operations.refine_knotvector() function is the controlling of
knot refinement density. It can increase the number of knots to be inserted in a knot vector. Therefore, it
increases the number of control points.
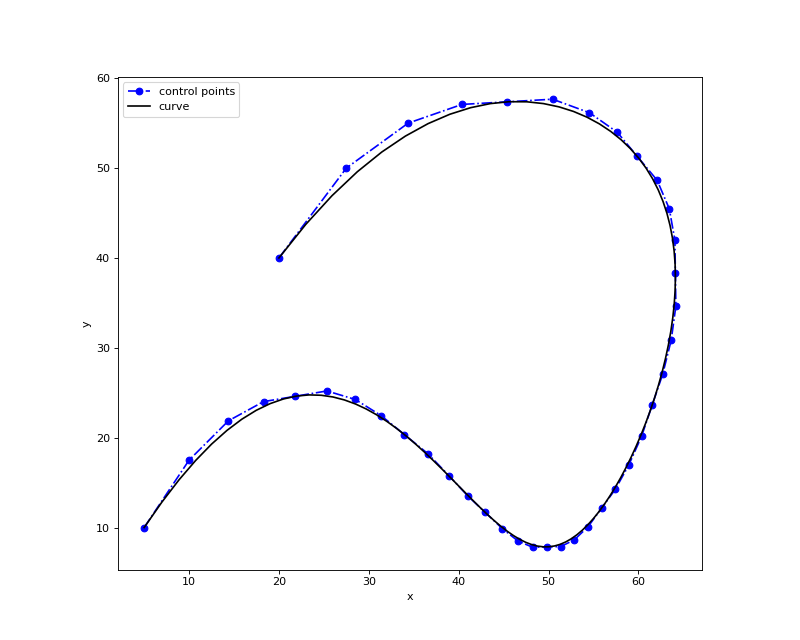
The following code snippet and the figure illustrate a 2-dimensional spline curve with knot refinement:
 1from geomdl import BSpline
 2from geomdl import utilities
 3from geomdl import exchange
 4from geomdl.visualization import VisMPL
 5
 6# Create a curve instance
 7curve = BSpline.Curve()
 8
 9# Set degree
10curve.degree = 4
11
12# Set control points
13curve.ctrlpts = [
14    [5.0, 10.0], [15.0, 25.0], [30.0, 30.0], [45.0, 5.0], [55.0, 5.0],
15    [70.0, 40.0], [60.0, 60.0], [35.0, 60.0], [20.0, 40.0]
16]
17
18# Set knot vector
19curve.knotvector = [0.0, 0.0, 0.0, 0.0, 0.0, 0.2, 0.4, 0.6, 0.8, 1.0, 1.0, 1.0, 1.0, 1.0]
20
21# Set visualization component
22curve.vis = VisMPL.VisCurve2D()
23
24# Refine knot vector
25operations.refine_knotvector(curve, [1])
26
27# Visualize
28curve.render()
(Source code, png, hires.png, pdf)
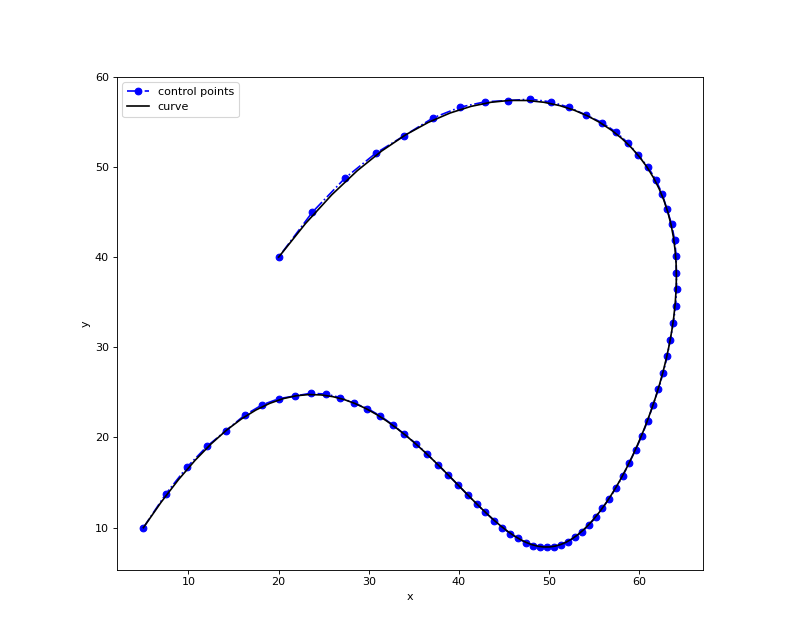
The default density value is 1 for the knot refinement operation. The following code snippet and the figure
illustrate the result of the knot refinement operation if density is set to 2.
 1from geomdl import BSpline
 2from geomdl import utilities
 3from geomdl import exchange
 4from geomdl.visualization import VisMPL
 5
 6# Create a curve instance
 7curve = BSpline.Curve()
 8
 9# Set degree
10curve.degree = 4
11
12# Set control points
13curve.ctrlpts = [
14    [5.0, 10.0], [15.0, 25.0], [30.0, 30.0], [45.0, 5.0], [55.0, 5.0],
15    [70.0, 40.0], [60.0, 60.0], [35.0, 60.0], [20.0, 40.0]
16]
17
18# Set knot vector
19curve.knotvector = [0.0, 0.0, 0.0, 0.0, 0.0, 0.2, 0.4, 0.6, 0.8, 1.0, 1.0, 1.0, 1.0, 1.0]
20
21# Set visualization component
22curve.vis = VisMPL.VisCurve2D()
23
24# Refine knot vector
25operations.refine_knotvector(curve, [2])
26
27# Visualize
28curve.render()
(Source code, png, hires.png, pdf)
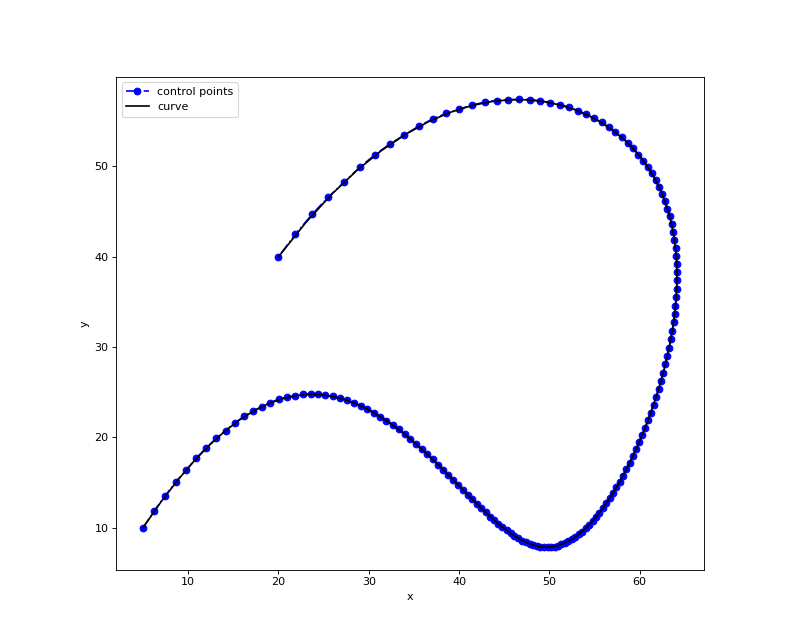
The following code snippet and the figure illustrate the result of the knot refinement operation if density is set
to 3.
 1from geomdl import BSpline
 2from geomdl import utilities
 3from geomdl import exchange
 4from geomdl.visualization import VisMPL
 5
 6# Create a curve instance
 7curve = BSpline.Curve()
 8
 9# Set degree
10curve.degree = 4
11
12# Set control points
13curve.ctrlpts = [
14    [5.0, 10.0], [15.0, 25.0], [30.0, 30.0], [45.0, 5.0], [55.0, 5.0],
15    [70.0, 40.0], [60.0, 60.0], [35.0, 60.0], [20.0, 40.0]
16]
17
18# Set knot vector
19curve.knotvector = [0.0, 0.0, 0.0, 0.0, 0.0, 0.2, 0.4, 0.6, 0.8, 1.0, 1.0, 1.0, 1.0, 1.0]
20
21# Set visualization component
22curve.vis = VisMPL.VisCurve2D()
23
24# Refine knot vector
25operations.refine_knotvector(curve, [3])
26
27# Visualize
28curve.render()
(Source code, png, hires.png, pdf)
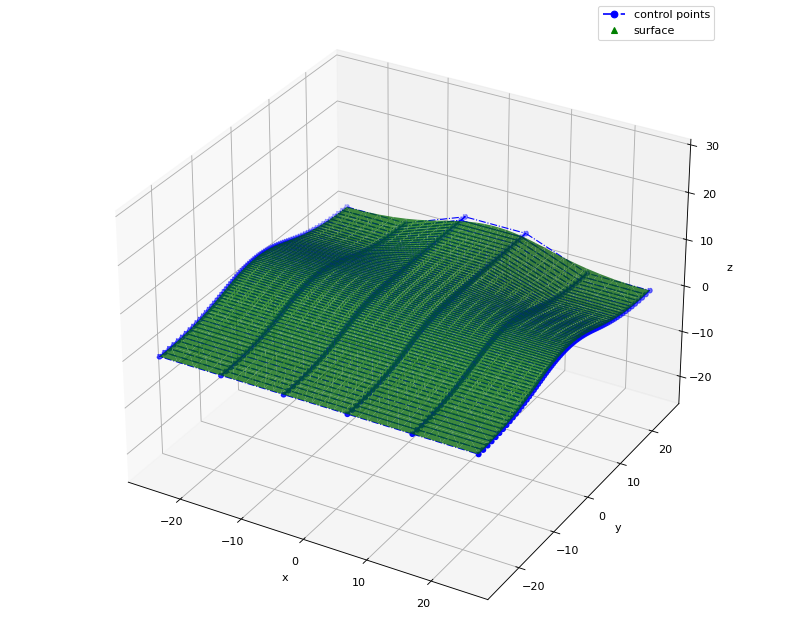
The following code snippet and the figure illustrate the knot refinement operation applied to a surface with density
value of 3 for the u-direction. No refinement was applied for the v-direction.
 1from geomdl import NURBS
 2from geomdl import operations
 3from geomdl.visualization import VisMPL
 4
 5
 6# Control points
 7ctrlpts = [[[25.0, -25.0, 0.0, 1.0], [15.0, -25.0, 0.0, 1.0], [5.0, -25.0, 0.0, 1.0],
 8            [-5.0, -25.0, 0.0, 1.0], [-15.0, -25.0, 0.0, 1.0], [-25.0, -25.0, 0.0, 1.0]],
 9           [[25.0, -15.0, 0.0, 1.0], [15.0, -15.0, 0.0, 1.0], [5.0, -15.0, 0.0, 1.0],
10            [-5.0, -15.0, 0.0, 1.0], [-15.0, -15.0, 0.0, 1.0], [-25.0, -15.0, 0.0, 1.0]],
11           [[25.0, -5.0, 5.0, 1.0], [15.0, -5.0, 5.0, 1.0], [5.0, -5.0, 5.0, 1.0],
12            [-5.0, -5.0, 5.0, 1.0], [-15.0, -5.0, 5.0, 1.0], [-25.0, -5.0, 5.0, 1.0]],
13           [[25.0, 5.0, 5.0, 1.0], [15.0, 5.0, 5.0, 1.0], [5.0, 5.0, 5.0, 1.0],
14            [-5.0, 5.0, 5.0, 1.0], [-15.0, 5.0, 5.0, 1.0], [-25.0, 5.0, 5.0, 1.0]],
15           [[25.0, 15.0, 0.0, 1.0], [15.0, 15.0, 0.0, 1.0], [5.0, 15.0, 5.0, 1.0],
16            [-5.0, 15.0, 5.0, 1.0], [-15.0, 15.0, 0.0, 1.0], [-25.0, 15.0, 0.0, 1.0]],
17           [[25.0, 25.0, 0.0, 1.0], [15.0, 25.0, 0.0, 1.0], [5.0, 25.0, 5.0, 1.0],
18            [-5.0, 25.0, 5.0, 1.0], [-15.0, 25.0, 0.0, 1.0], [-25.0, 25.0, 0.0, 1.0]]]
19
20# Generate surface
21surf = NURBS.Surface()
22surf.degree_u = 3
23surf.degree_v = 3
24surf.ctrlpts2d = ctrlpts
25surf.knotvector_u = [0.0, 0.0, 0.0, 0.0, 1.0, 2.0, 3.0, 3.0, 3.0, 3.0]
26surf.knotvector_v = [0.0, 0.0, 0.0, 0.0, 1.0, 2.0, 3.0, 3.0, 3.0, 3.0]
27surf.sample_size = 30
28
29# Set visualization component
30surf.vis = VisMPL.VisSurface(VisMPL.VisConfig(alpha=0.75))
31
32# Refine knot vectors
33operations.refine_knotvector(surf, [3, 0])
34
35# Visualize
36surf.render()
(Source code, png, hires.png, pdf)