Visualization
NURBS-Python comes with the following visualization modules for direct plotting evaluated curves and surfaces:
Examples repository contains over 40 examples on how to use the visualization components in various ways. Please see Visualization Modules Documentation for more details.
Examples
The following figures illustrate some example NURBS and B-spline shapes that can be generated and directly visualized via NURBS-Python.
Curves
(Source code, png, hires.png, pdf)
(Source code, png, hires.png, pdf)
Surfaces
(Source code, png, hires.png, pdf)
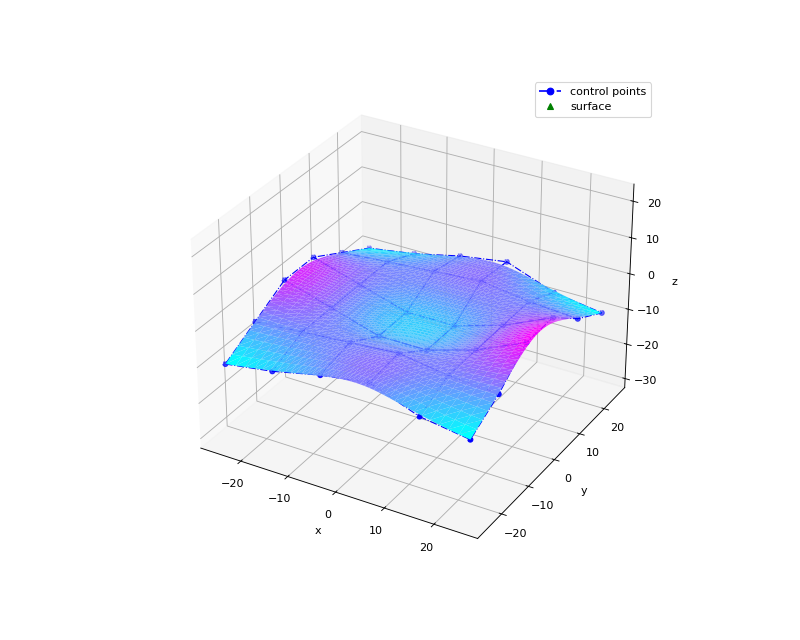
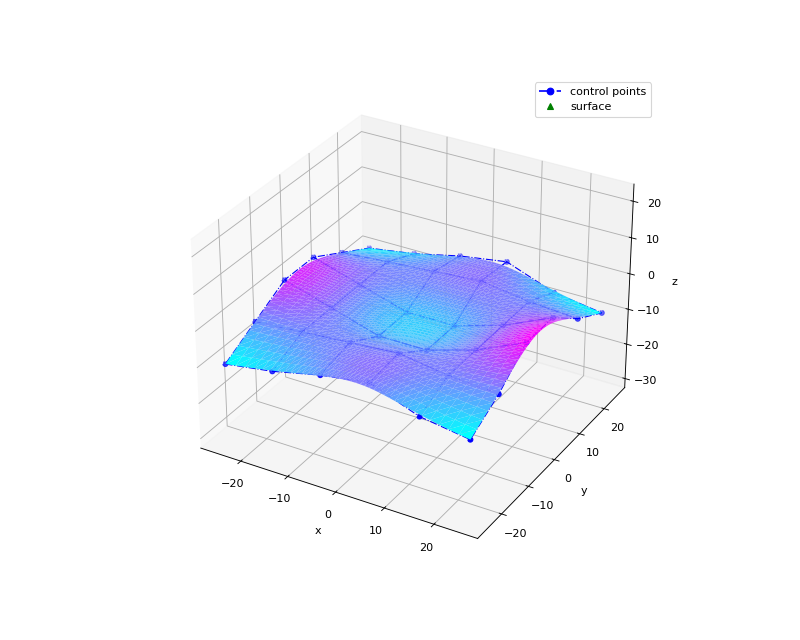
(Source code, png, hires.png, pdf)
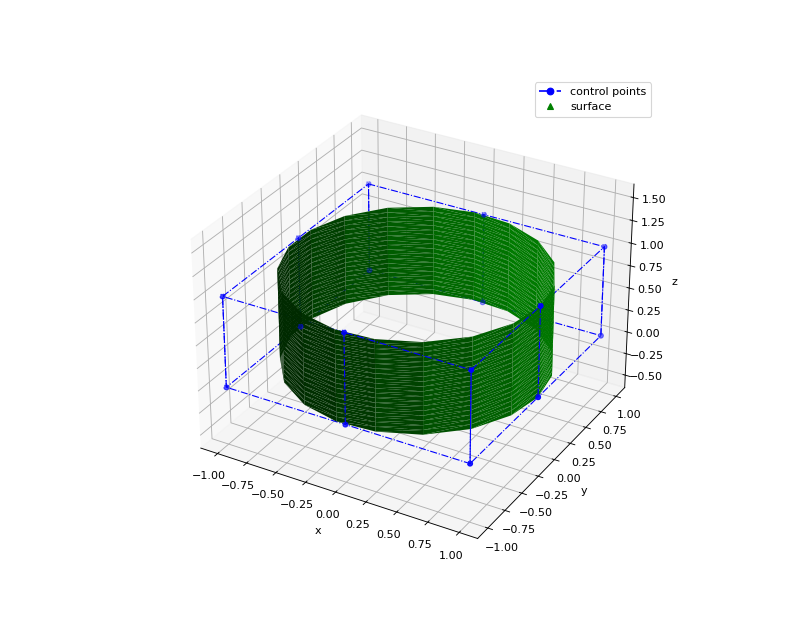
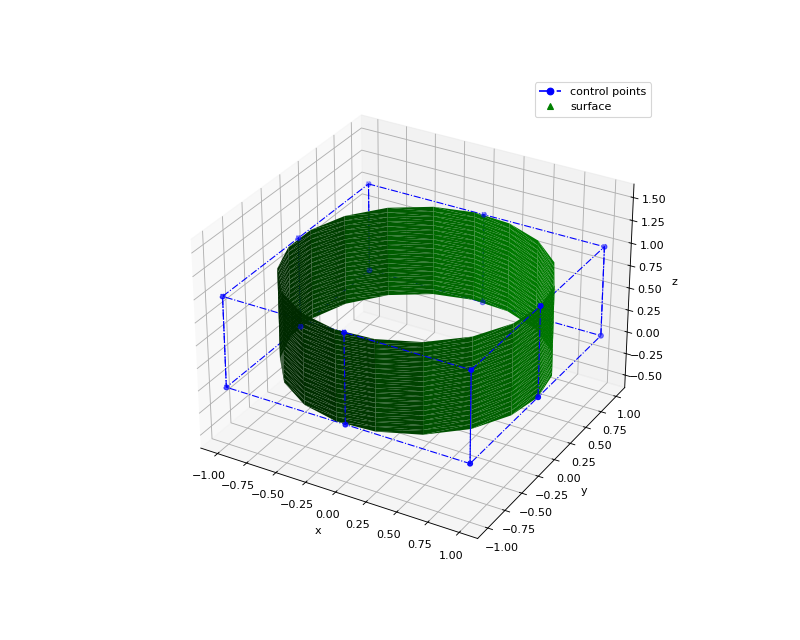
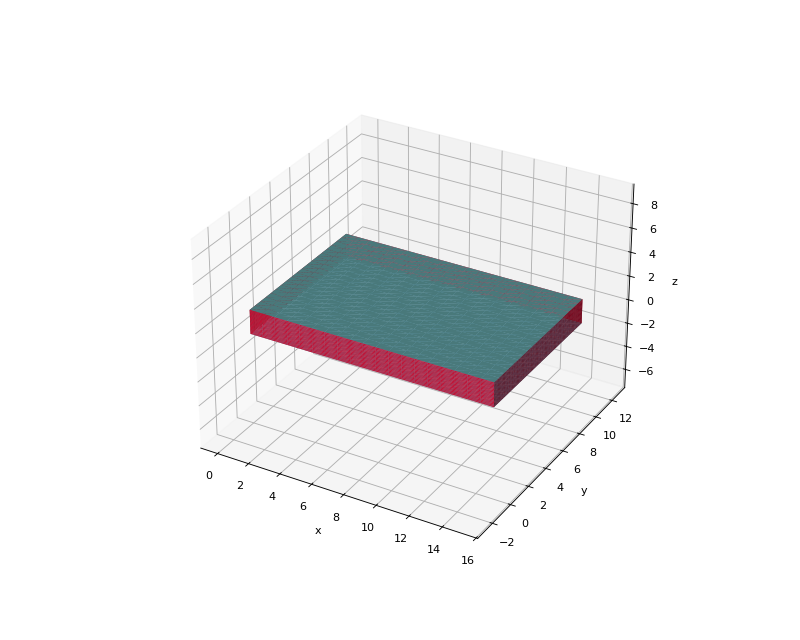
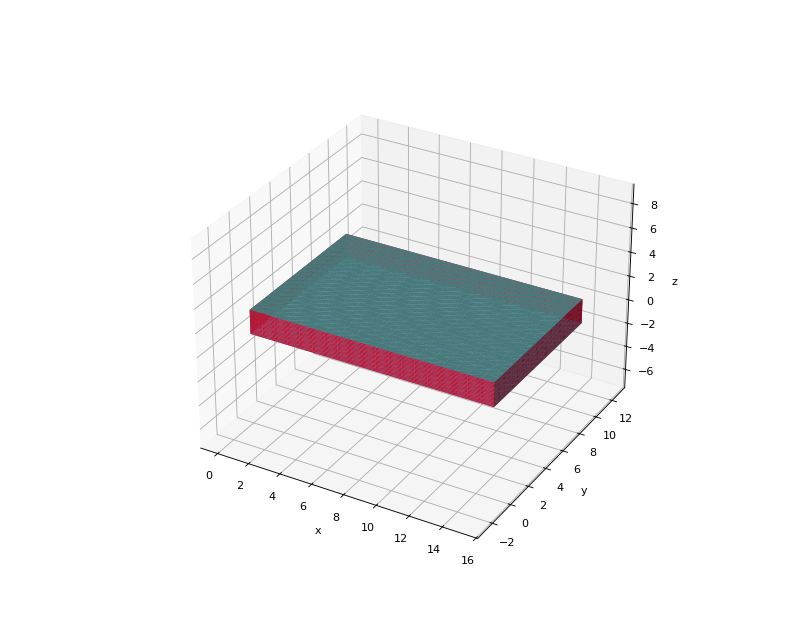
Volumes
(Source code, png, hires.png, pdf)
Advanced Visualization Examples
The following example scripts can be found in Examples repository under the visualization directory.
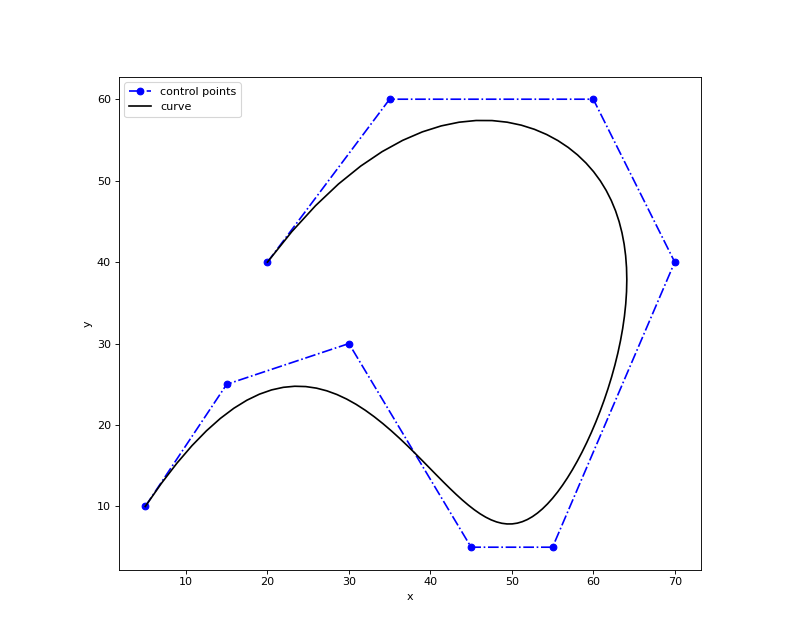
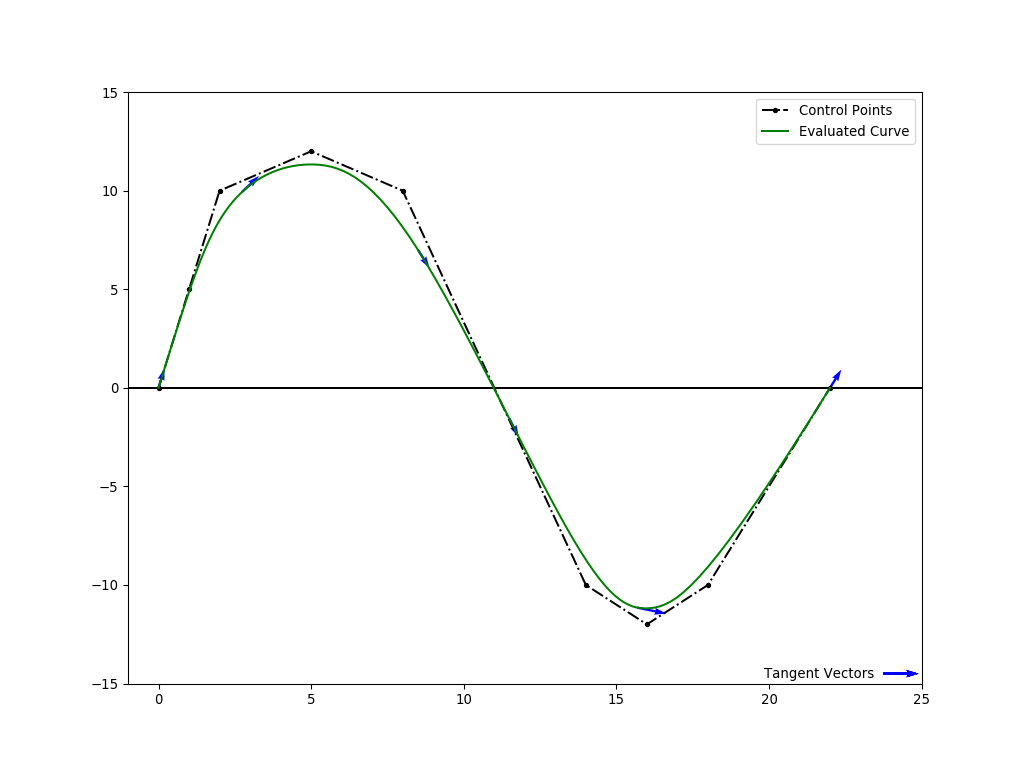
mpl_curve2d_tangents.py
This example illustrates a more advanced visualization option for plotting the 2D curve tangents alongside with the control points grid and the evaluated curve.
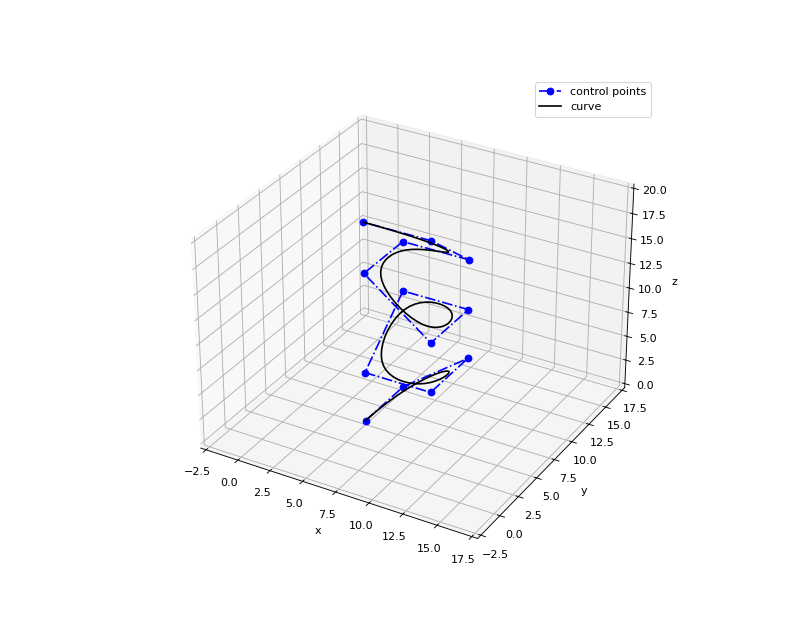
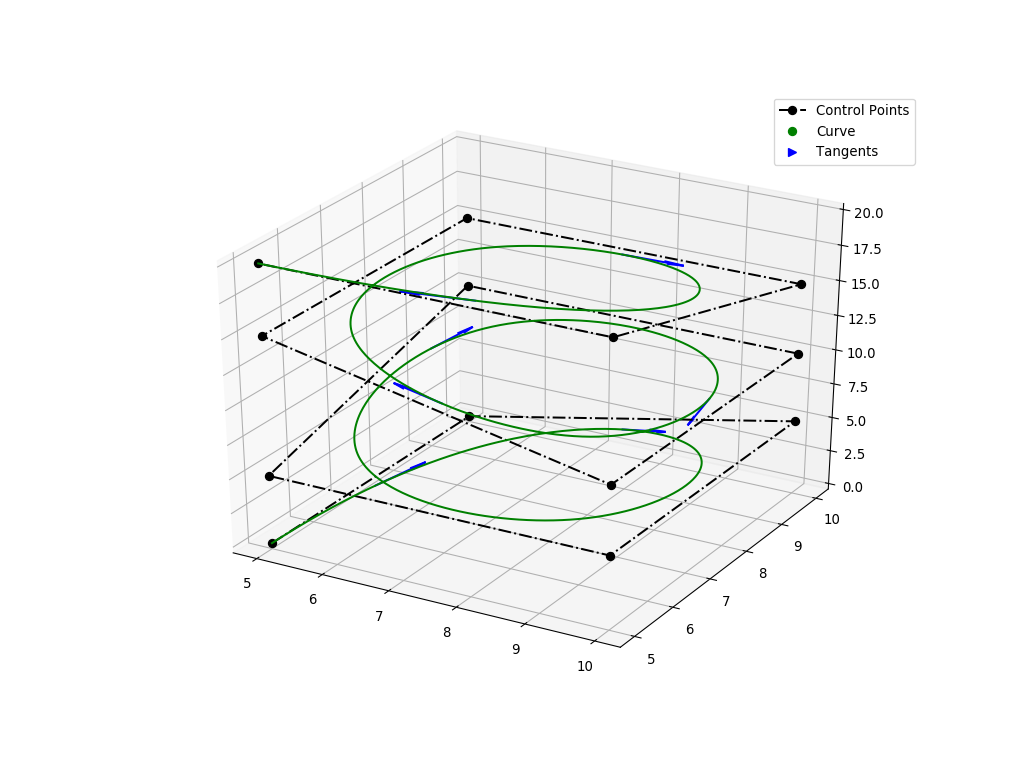
mpl_curve3d_tangents.py
This example illustrates a more advanced visualization option for plotting the 3D curve tangents alongside with the control points grid and the evaluated curve.
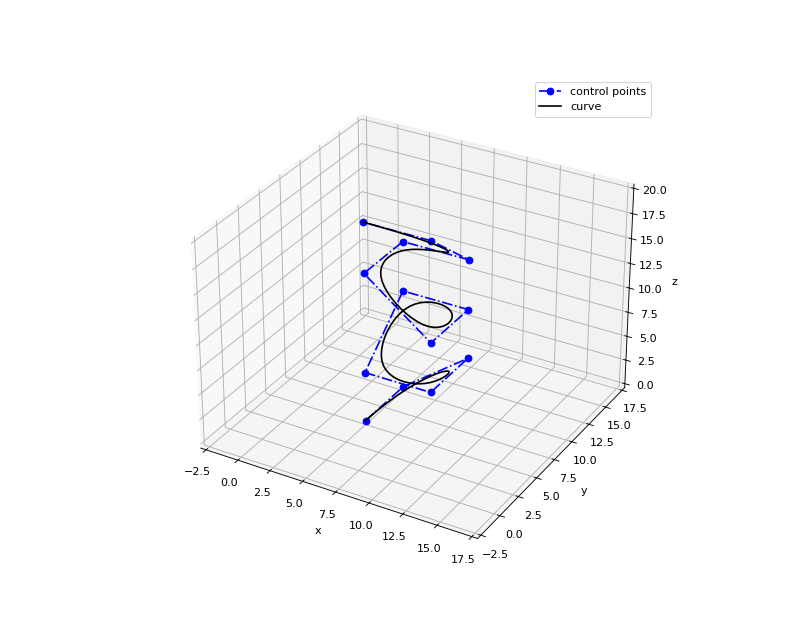
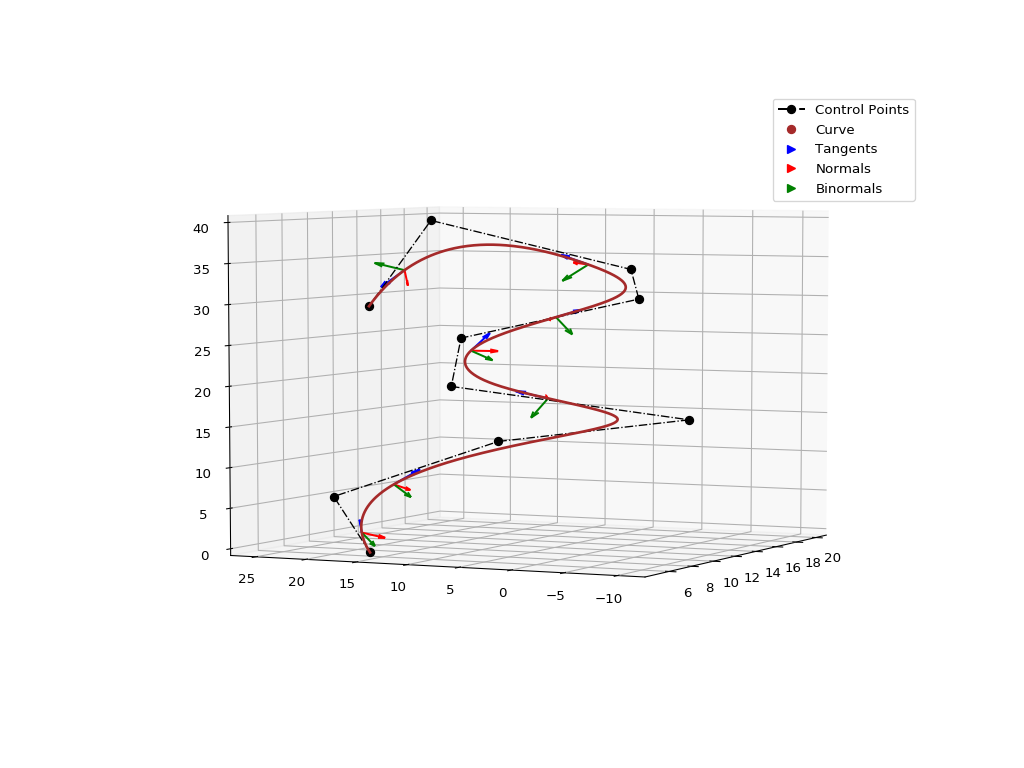
mpl_curve3d_vectors.py
This example illustrates a visualization option for plotting the 3D curve tangent, normal and binormal vectors alongside with the control points grid and the evaluated curve.
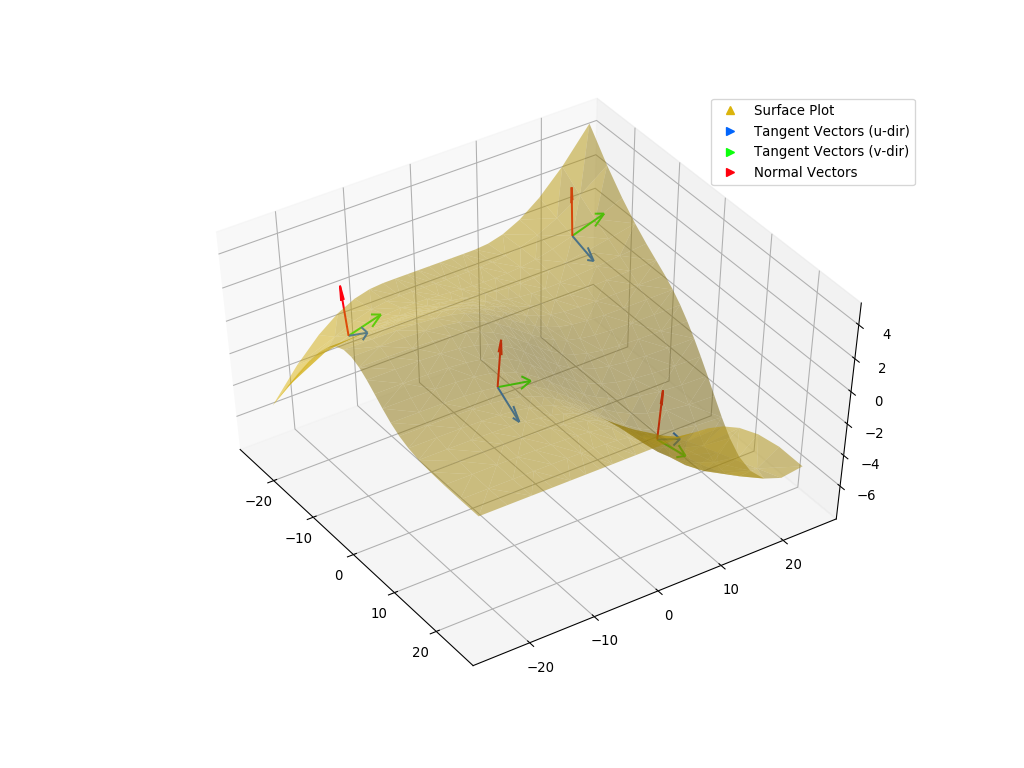
mpl_trisurf_vectors.py
The following figure illustrates tangent and normal vectors on ex_surface02.py example.